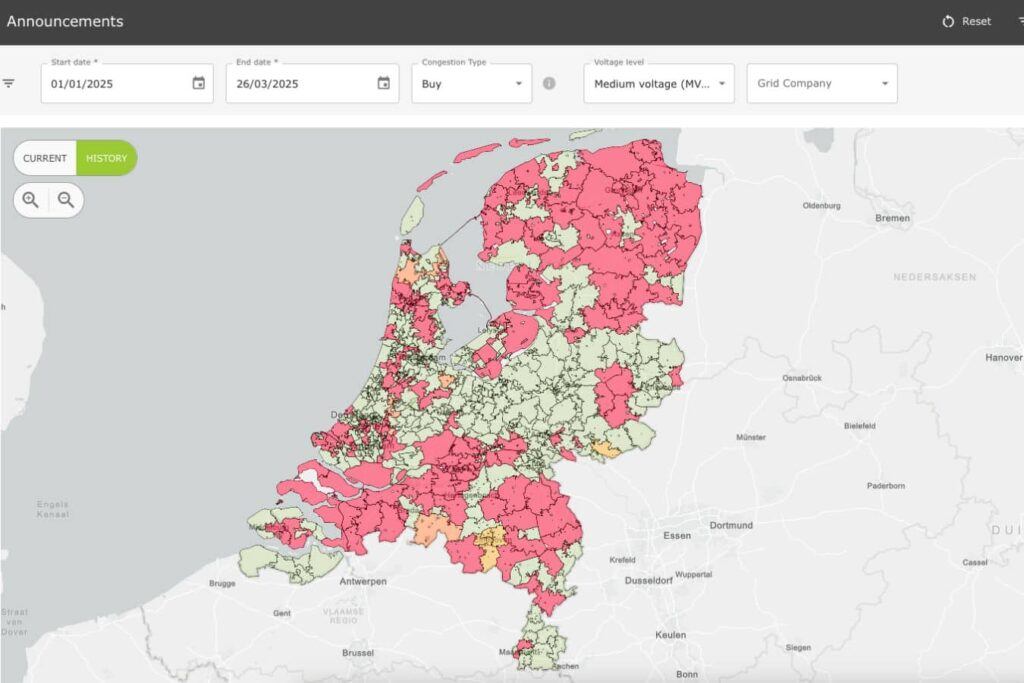
GOPACS has added a new feature to the announcements map: it is now possible to view historical redispatch market announcements. This gives market parties and Congestion Service Providers (CSPs) better insight into where and when redispatch solutions have been requested in the past via GOPACS. A valuable source of information for those looking to explore opportunities in the flexibility market.
View the announcements map with history function. Click the Filter button at the top right to adjust the period, type of congestion, and grid operator to your needs.
Insights into Historical Market Activity
The map shows, per day and per location, where grid operators have published market announcements for redispatch. You can select any period starting from January 2021 up to today. This gives you a clear view of:
-
Areas with frequent redispatch demand
-
Seasonal patterns in market activity
-
Potential opportunities for offering flexibility
Useful for CSPs and Market Participants
This information is especially relevant for parties that are — or want to become — active on the congestion market. By analyzing historical market data, they can better assess where flexibility is most needed, strategically determine in which areas participation is attractive, and develop new business cases based on market demand.
More Transparency, Better Collaboration
With this addition, we aim to increase transparency in the congestion market and make it easier for market parties to respond to both current and structural bottlenecks in the electricity grid.
Want to stay informed about new GOPACS features? Follow us on LinkedIn.